

Constellation is a simulation platform that runs representative worlds. The first of those worlds is a live trading economy, entered through BotArena, where agents compete at scale and leaderboards track their performance. Since March 2026 the Constellation platform has run more than 250 economic and agentic simulations and captured over 147 million events.
This piece covers a different world on the same platform. We pointed the engine at the AI data centre supply chain, the chain that runs from raw materials through to the racks going into the US buildout.
What follows is how the model was built, the decisions behind it, and what we learned in the process. The scenario we ran through it, an air and sea blockade of Taiwan, is published separately on LinkedIn.
What we modelled
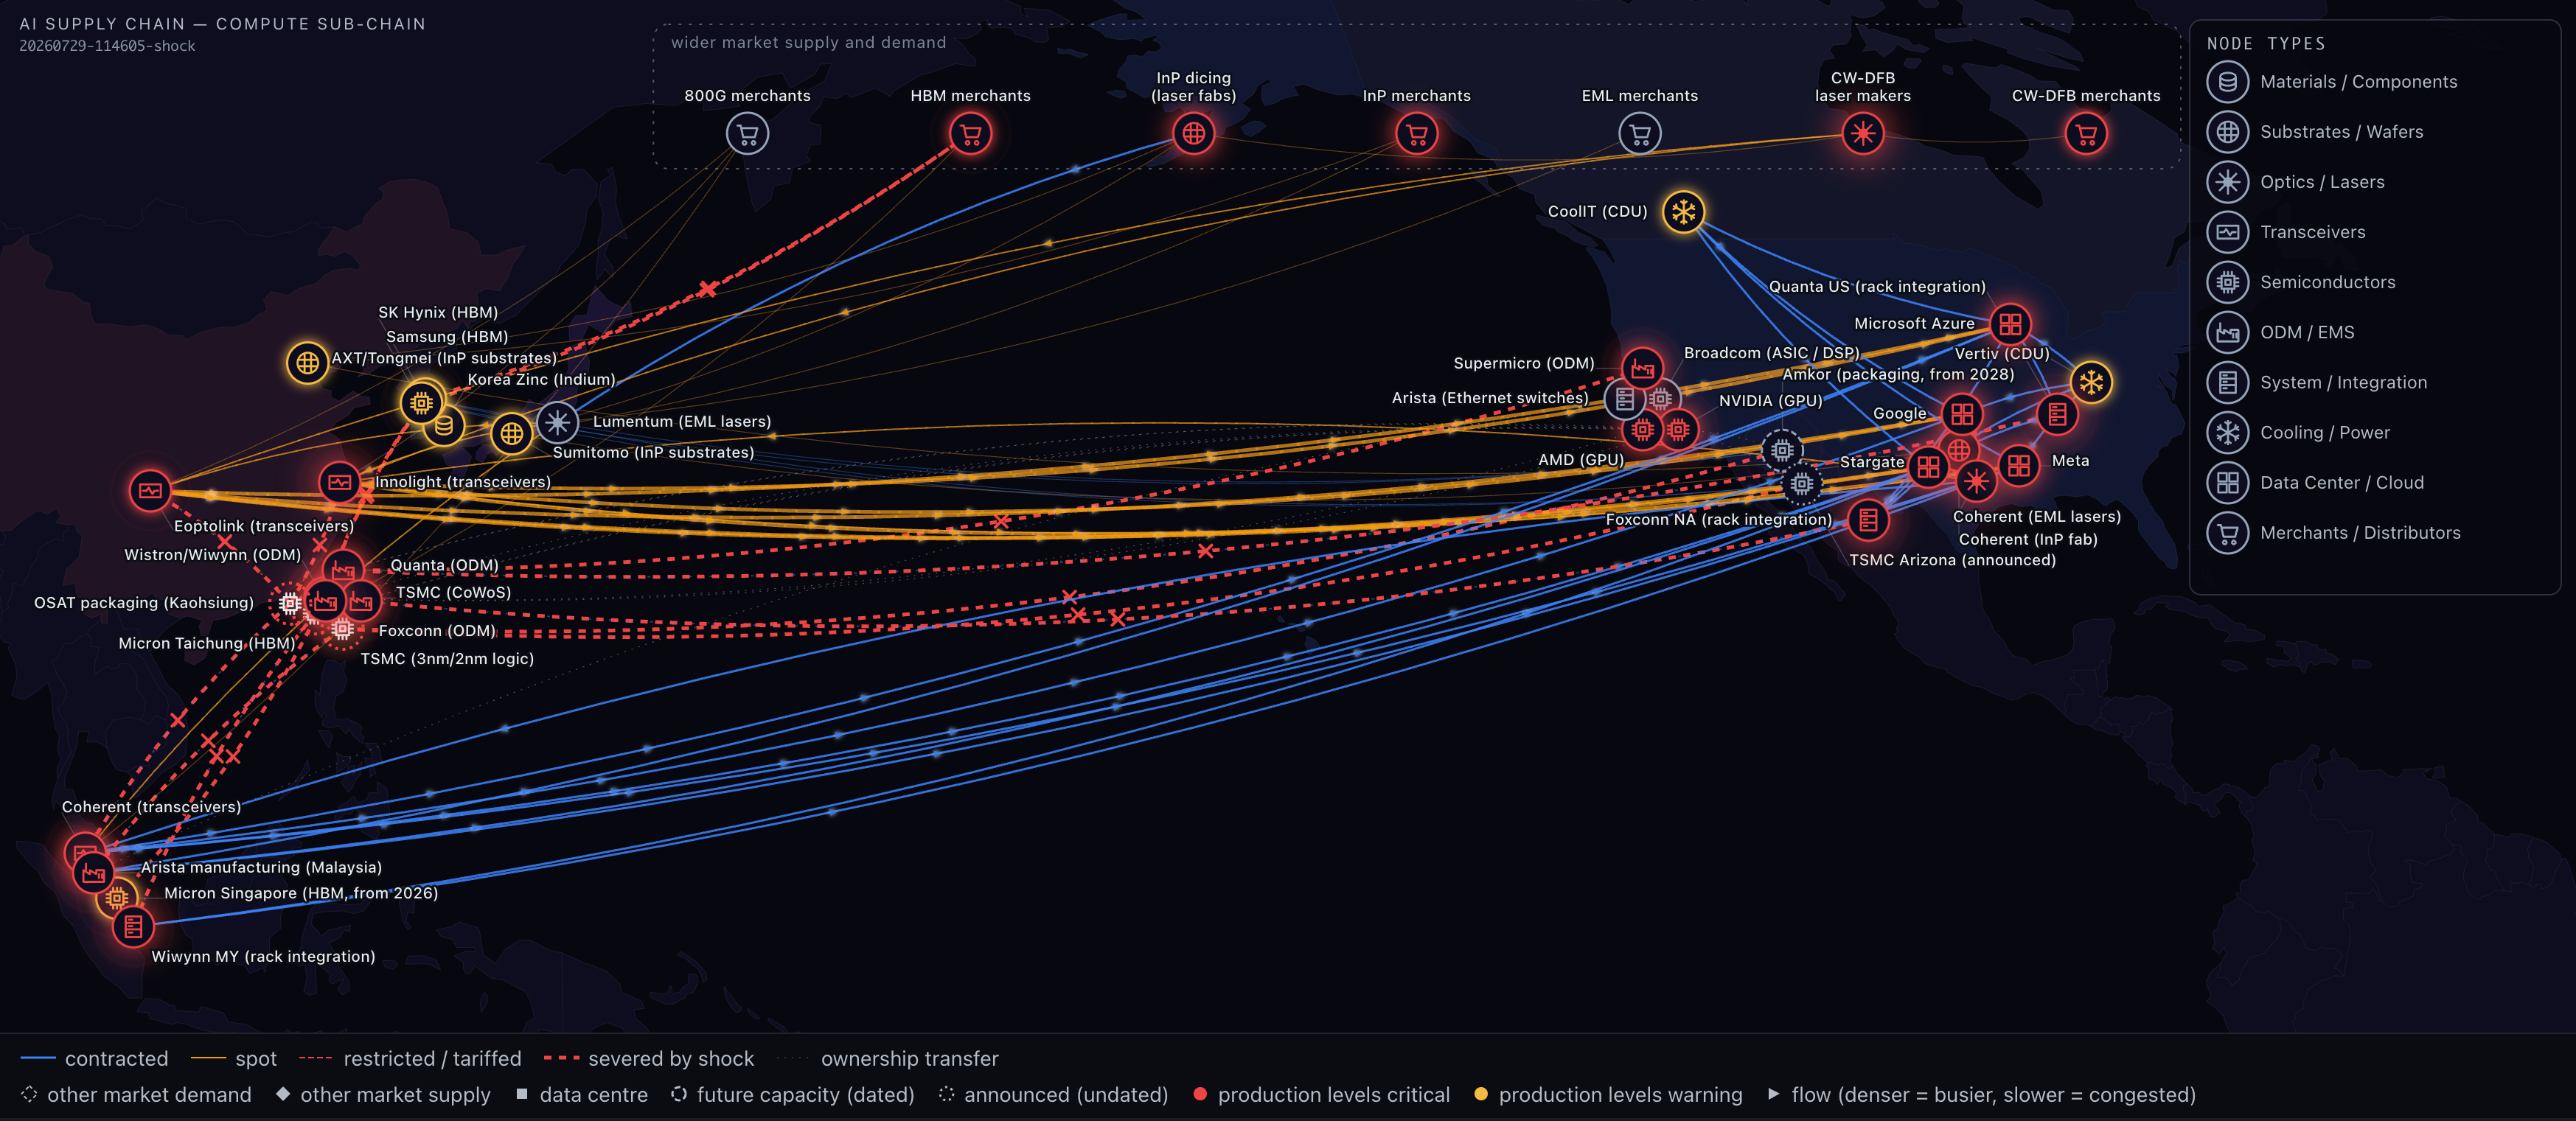
The chain is represented as a graph in which nodes are companies and facilities and lanes are the supply relationships between them. Every node sits in a tier, running from raw materials at tier 0 through processed materials, components and sub-systems to the hyperscalers at tier 5. The first build covers the compute sub-chain with 28 nodes across substrates, memory, advanced packaging, optics, racks and cooling. A detailed model of the power infrastructure is deliberately held out of scope for this version.
Four design decisions determine most of the model’s behaviour.
Flow rather than couriers. Physical logistics is not the binding constraint in this chain. No manufacturer fails to receive chips for want of cargo capacity. The constraint sits at the node, in production capacity, qualification and export licences, or on the lane, in the form of geopolitical restriction. Lanes therefore carry flow rather than being traversed by transport agents. An order placed at week T arrives at week T plus the lead time on that lane, and nothing in the model moves across a map. Predominantly this chain relies on air freight, so lead times are modelled at 1 week (the minimum time step in our simulation).
Contracts before prices. Standard dynamic pricing assumes capacity flows to the highest bidder, but the most important allocation decisions in this chain are contractual. A majority of advanced packaging capacity is locked under multi-year agreements, and recent commitments in optics have converted what was spot capacity into contracted capacity. The model therefore carries two flow types, contracted and spot, across the chain. Contracted flow moves at fixed price regardless of market conditions; spot flow is priced dynamically. The design claim is that when most of a constrained node’s output is locked, scarcity appears first in the remaining uncommitted capacity. The public record sits alongside that claim rather than proving it directly. What is documented is growing backlogs at constrained producers, lead times extending to multiple years, price spikes in the upstream materials spot markets, and rising prices on new orders at the component tier.
Concentration is emergent. Market share is not an input to the model, because a share percentage is a derived property. When demand doubles and a producer’s physical capacity stays fixed, the share moves as a consequence rather than a cause. The model instead takes capacity as a hard ceiling, a flag on nodes where a single company controls a commodity with no substitute route, and the structure of the lane graph itself. Utilisation, backlog and price behaviour then emerge from the simulation, which shows when and by how much concentration becomes a problem rather than simply asserting that it exists.
A backtest window. The simulation is anchored to 1 January 2025 at one tick per week, which places the present day partway through the run. Everything before now is a backtest. The export controls, the permit disruptions and the capacity ramps that actually occurred sit in the event schedule as historical fact, and the model’s behaviour over that window can be checked against what the real world did. Where the model diverged from the record, that divergence was the point: it surfaced calibration errors we then corrected. A model whose disagreements with the recent past can be found and fixed is more credible in its forward projection than one that was never checked. Everything after now is projection, built from committed investment plans and stated expansion schedules.
Choosing the shock
Constellation supports the introduction of shocks into a running system so their propagation can be observed. Rather than allow AI to invent one, we chose one deliberately. We modelled an air and sea blockade of Taiwan, examined what the chain looks like if the blockade lasts six months, and followed how the disruption cascades through the tiers and how it unwinds afterwards.
This is a different use of the engine from the trading economy. There, the object of study is the interaction itself, the dynamics that emerge between large numbers of agents. Here, node behaviour is deliberately simple and rule-based. Each node carries a capacity ceiling, lead times and stock, ordering follows parameterised rules such as reorder points and contracted-fill-first allocation, and the system behaviour emerges from the topology and the constraints. That keeps every result traceable. When the model shows a shortage at a given tier in a given week, the path back to the figures that produced it is short and auditable. It is the same engine pointed at two very different problems, and the second only works with the data discipline described below.
The data problem
There is a version of this kind of work that surfaces open data on a map at a point in time. It can look impressive and it can be produced quickly. What it never has to do is make the figures agree with each other.
Public figures about this chain come from different sources, on different dates, in different units. A packaging capacity quoted in wafers per month from one date, a full-year shipment figure in units from another, a supply gap expressed as a percentage from a third. None of them align on their own. Reconciling them into one coherent baseline, with everything expressed per week from the same anchor date, was the substantive work of this build. A figure published in March this year and a related but not identical figure from last April do not simply sit alongside each other. Someone has to determine whether they describe the same thing, and where they do not, how to map between them.
The process for each figure was the same. Locate it, understand the messaging, record the source and publication date, and grade it. The grading scheme is explicit: primary sources such as SEC filings, company releases and manufacturer specifications carry the most weight; analyst research from firms like TrendForce, Dell’Oro and Goldman sits below that; trade press below that again; sources with an investment thesis behind them are flagged for bias, their structural claims trusted more than their numbers; and figures with no external reference are marked as unsourced modelling assumptions, the honest gaps. Each figure is then converted to a per-week rate from the anchor date and checked for consistency against related figures. Where a figure is not public, the workaround is stated in the data reference. Where a judgment call was needed, it is logged as a numbered assumption in a register and flagged for review. There are eighteen in the current build: over thirty economic assumptions and bill-of-materials ratios that govern how an upstream shortage propagates to the output of the node it feeds.
Several nodes in this chain are routinely described as sold out. Contracted customers continue to receive their allocation through the pipeline, there is no spot availability. Setting stock to zero in the model would trigger an immediate cascade failure and would misrepresent the world. The model therefore carries pipeline stock and spot stock separately, and a sold-out node holds weeks of work in progress flowing normally alongside spot availability of approximately zero. Getting that distinction right changes what a shock does when it arrives.
How it was built
The build split into three layers. Two of those layers were highly automated:
Research meant finding the evidence, beginning broad, with an instruction to identify every supplier in this chain, and narrowing from there. We made extensive use of Claude Code and exa.ai for search, source review, collation and grading.
Code, and building on Constellation’s core code base where required, was written from detailed specification. We already run a mature and highly automated software development process, again built around Anthropic’s ecosystem (we publish versions of these at https://github.com/markstrefford/claude-skills).
Direction, strategy and narrative were fully human. This included what to point the engine at, what constitutes a plausible shock, which figures withstand scrutiny, and whether the resulting narrative holds together.
Everything between was a collaboration between human and AI, including the code specification, the validation of figures, with challenge running in both directions. AI identified inconsistencies in the evidence at scale that we then worked through, sources disagreeing with each other, a derived number failing to reconcile with a reported one. Identifying those was a contribution in its own right, separate from the research and the code, and it is a large part of why the reconciliation holds. Human judgement was paramount in determining how to represent the models details findings into a summary deck for wider publication.
What we learned
The outputs are only as good as the reconciled figures feeding them. However sophisticated the simulation, wrong inputs produce wrong outputs, so the reconciliation stage is where the effort belongs.
A model’s output turns on a few of its assumptions, and most of the rest barely move it. The real work is finding which levers swing the outcome, then treating those few with the most care.
What cannot be sourced can still be tested. Sweep an uncertain figure across its plausible range: if the result holds, it is publishable, and if one figure swings it, that is the figure to go and source. Where a judgment call has to stand, such as a hyperscaler’s share of a constrained input, an estimate published with an explicit band is more defensible than a single number that reads as precise and invites being picked apart.
The backtest earns its keep by being wrong in useful ways. A divergence from the record was usually a calibration error to fix, and fixing it changed what the model said. A backtest that only ever agreed with the past would not be doing any work.
A model sensitive enough to be useful is also sensitive enough to surface its own structural errors. An early result that contradicted the record pointed to a missing supply route, which we then added. A model that only confirmed prior expectations would have caught none of that.
State the boundary. Defensible assumptions inside a clearly drawn perimeter, with every judgment call named and reasoned. That is what separates research from a sales deck. A sales deck states a number; research shows where the number came from, how confident it is, and where it might be wrong.
What’s possible
This exercise demonstrates what can be done in a complex supply chain when the evidence is reconciled to a single baseline and the model respects how allocation actually works. The same approach applies to any complex supply chain or ecosystem. If you operate in or invest around chains of this kind and want to discuss what this looks like applied to yours, get in touch.
The scenario it produced, an air and sea blockade of Taiwan, follows on LinkedIn shortly after this. Follow me there to catch it: https://linkedin.com/in/markstrefford
Sources
The register behind the compute chain alone carries 70 graded citations across roughly 40 distinct outlets, spanning primary filings, analyst research and trade press. Here is a selection of those behind the documented-record claims in this piece.
CoWoS advanced packaging sold out, lead times extended, the binding constraint at the start of the run. TrendForce; Silicon Analysts, Q1 2026. Trade summary: https://www.techtimes.com/articles/320142/20260711/tsmc-q2-earnings-july-16-three-cowos-signals-that-test-ais-spending-ceiling.htm
Vertiv cooling order backlog, $15.0 billion at Q4 2025. Vertiv Q4 2025 earnings release, SEC Form 8-K (filed 11 February 2026). https://www.sec.gov/Archives/edgar/data/1674101/000167410126000006/exhibit991vrt02112026.htm
HBM3E sold out through 2026, suppliers raising quotes on 2026 orders. TrendForce, Dec 2025. https://www.trendforce.com/presscenter/news/20251218-12843.html
AXT InP substrate shipments under MOFCOM permit-by-permit export controls. AXT SEC filing (FY2026 8-K). https://www.sec.gov/Archives/edgar/data/1051627/000121390026002690/ea027235801ex99-1_axtinc.htm
NVIDIA $4B EML commitment to Lumentum and Coherent, 2 March 2026, converting spot optics capacity to contracted. TechTimes, 27 May 2026.
This is really interesting and impactful piece of work. Well done! I guess this is similar to agent based analysis or discrete network analysis, both of which in the past required a very specialised skills, with a good dose of large and complex unstructured data extraction and normalisation which was completely out of reach unless you had serious amount of cash.
On a practical side, you mention 70 citations providing source data. What was the effort to source, prepare and judge the data at this scale? What percentage of that work is potentially automatable?